
PACCAR ADAS Study
Project overview
My responsibilities: I designed and facilitated the user interviews and questionnaires, analyzed the qualitative and quantitive data, and translated the results into recommendations for future releases.
-
UX Researcher
-
Interviews, surveys, affinity mapping
-
6 heavy-duty truck drivers
-
Google Docs, Figjam
-
3 months
Background
When PACCAR was preparing to launch the latest version of their Advanced Driver Assistance System (ADAS) for heavy-duty trucks, I was tasked with understanding the driver’s experience with the system. I designed a mixed-methods research study to capture perceptions of driver trust, satisfaction, and usability pain points and then presented actionable recommendations to relevant stakeholders.
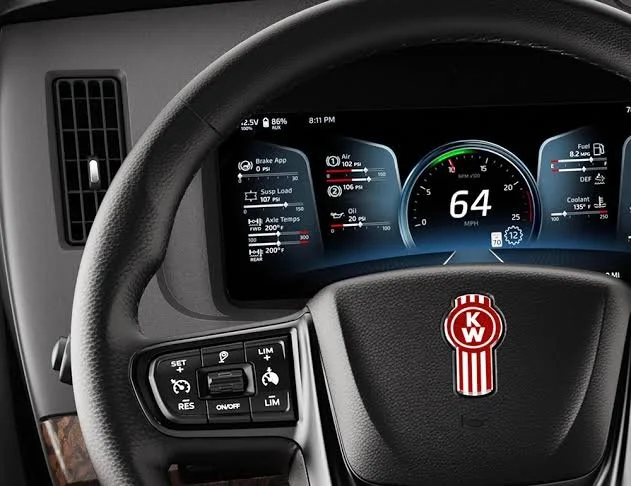
research Overview
Participants: 6 heavy-duty truck drivers
Methods: 1-1.5 hour in-person interview & survey
Data Collected:
Quantitative —> likert-scale satisfaction, likelihood to use, and performance ratings
Qualitative —> open-ended questions on positive, negative, and surprising experiences
Features Evaluated:
Adaptive Cruise Control (ACC)
Forward Distance Alerts (FDA)
Traffic Sign Recognition (TSR)
High Beam Assist (HBA)
Lane Departure Warning (LDW)
Highway Departure Braking (HDB)
Automated Emergency Braking (AEB)
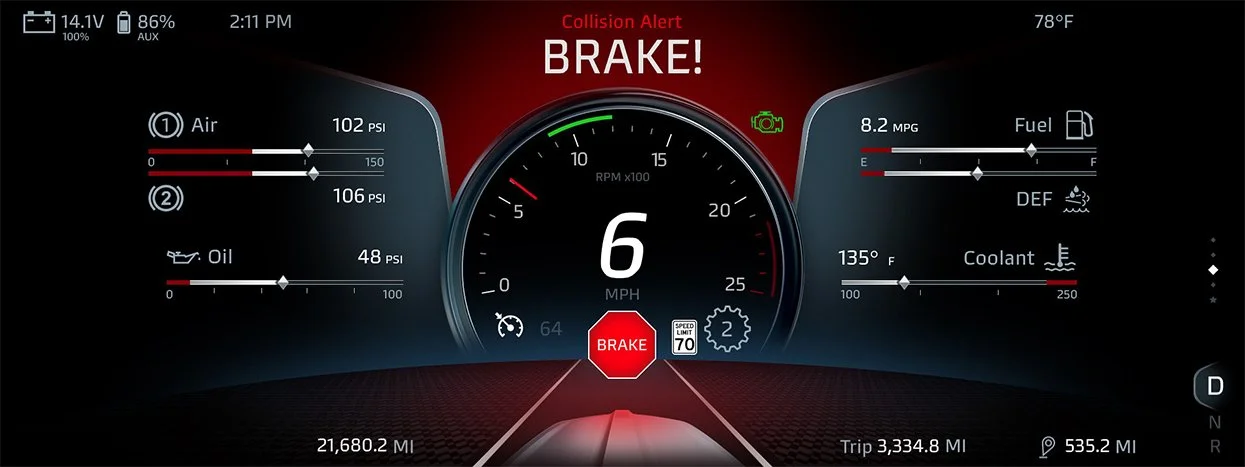
Example of Forward Distance Alert on digital dashboard.
Methodology
Approach
This study took a mixed-methods approach to capturing data. The questionnaire included open-ended questions and closed-ended survey scales to capture both qualitative and quantitative data in the same survey tool.
Recruitment
Participants were selected by the Verification team lead based on test drive schedules and who would be returning within the appropriate timeline. One scheduling consideration was wanting the interviews/questionnaire to be conducted the same day people finished their drives so the information was fresh on their minds.
Prior to the test drive, participants had varying levels of familiarity with safety features.
4 were “engineer-drivers,” meaning they are employed by PACCAR as engineers and have some familiarity with the technical functions of the safety system features.
2 were “customer-drivers,” meaning they are contracted by PACCAR as drivers and do not have engineering backgrounds or familiarity with the technical functions of the features.
Participant Education
All drivers received subject matter education by PACCAR safety system engineers prior to heading out on their test drives. This included information about which functions to use and how they behave, how they show up on the digital display, etc. (This education happened independently and was not part of my responsibilities.)
Visual Aids
Because participants had varying levels of safety system knowledge (and to facilitate recall), at the beginning of each interview session, I provided them with printed sheets of relevant information they could reference during the interview process, including:
a list of definitions of each safety feature along with a visual representation of how they show up on the digital display
a list of safety system fault states along with a visual representation of how they show up on the digital display
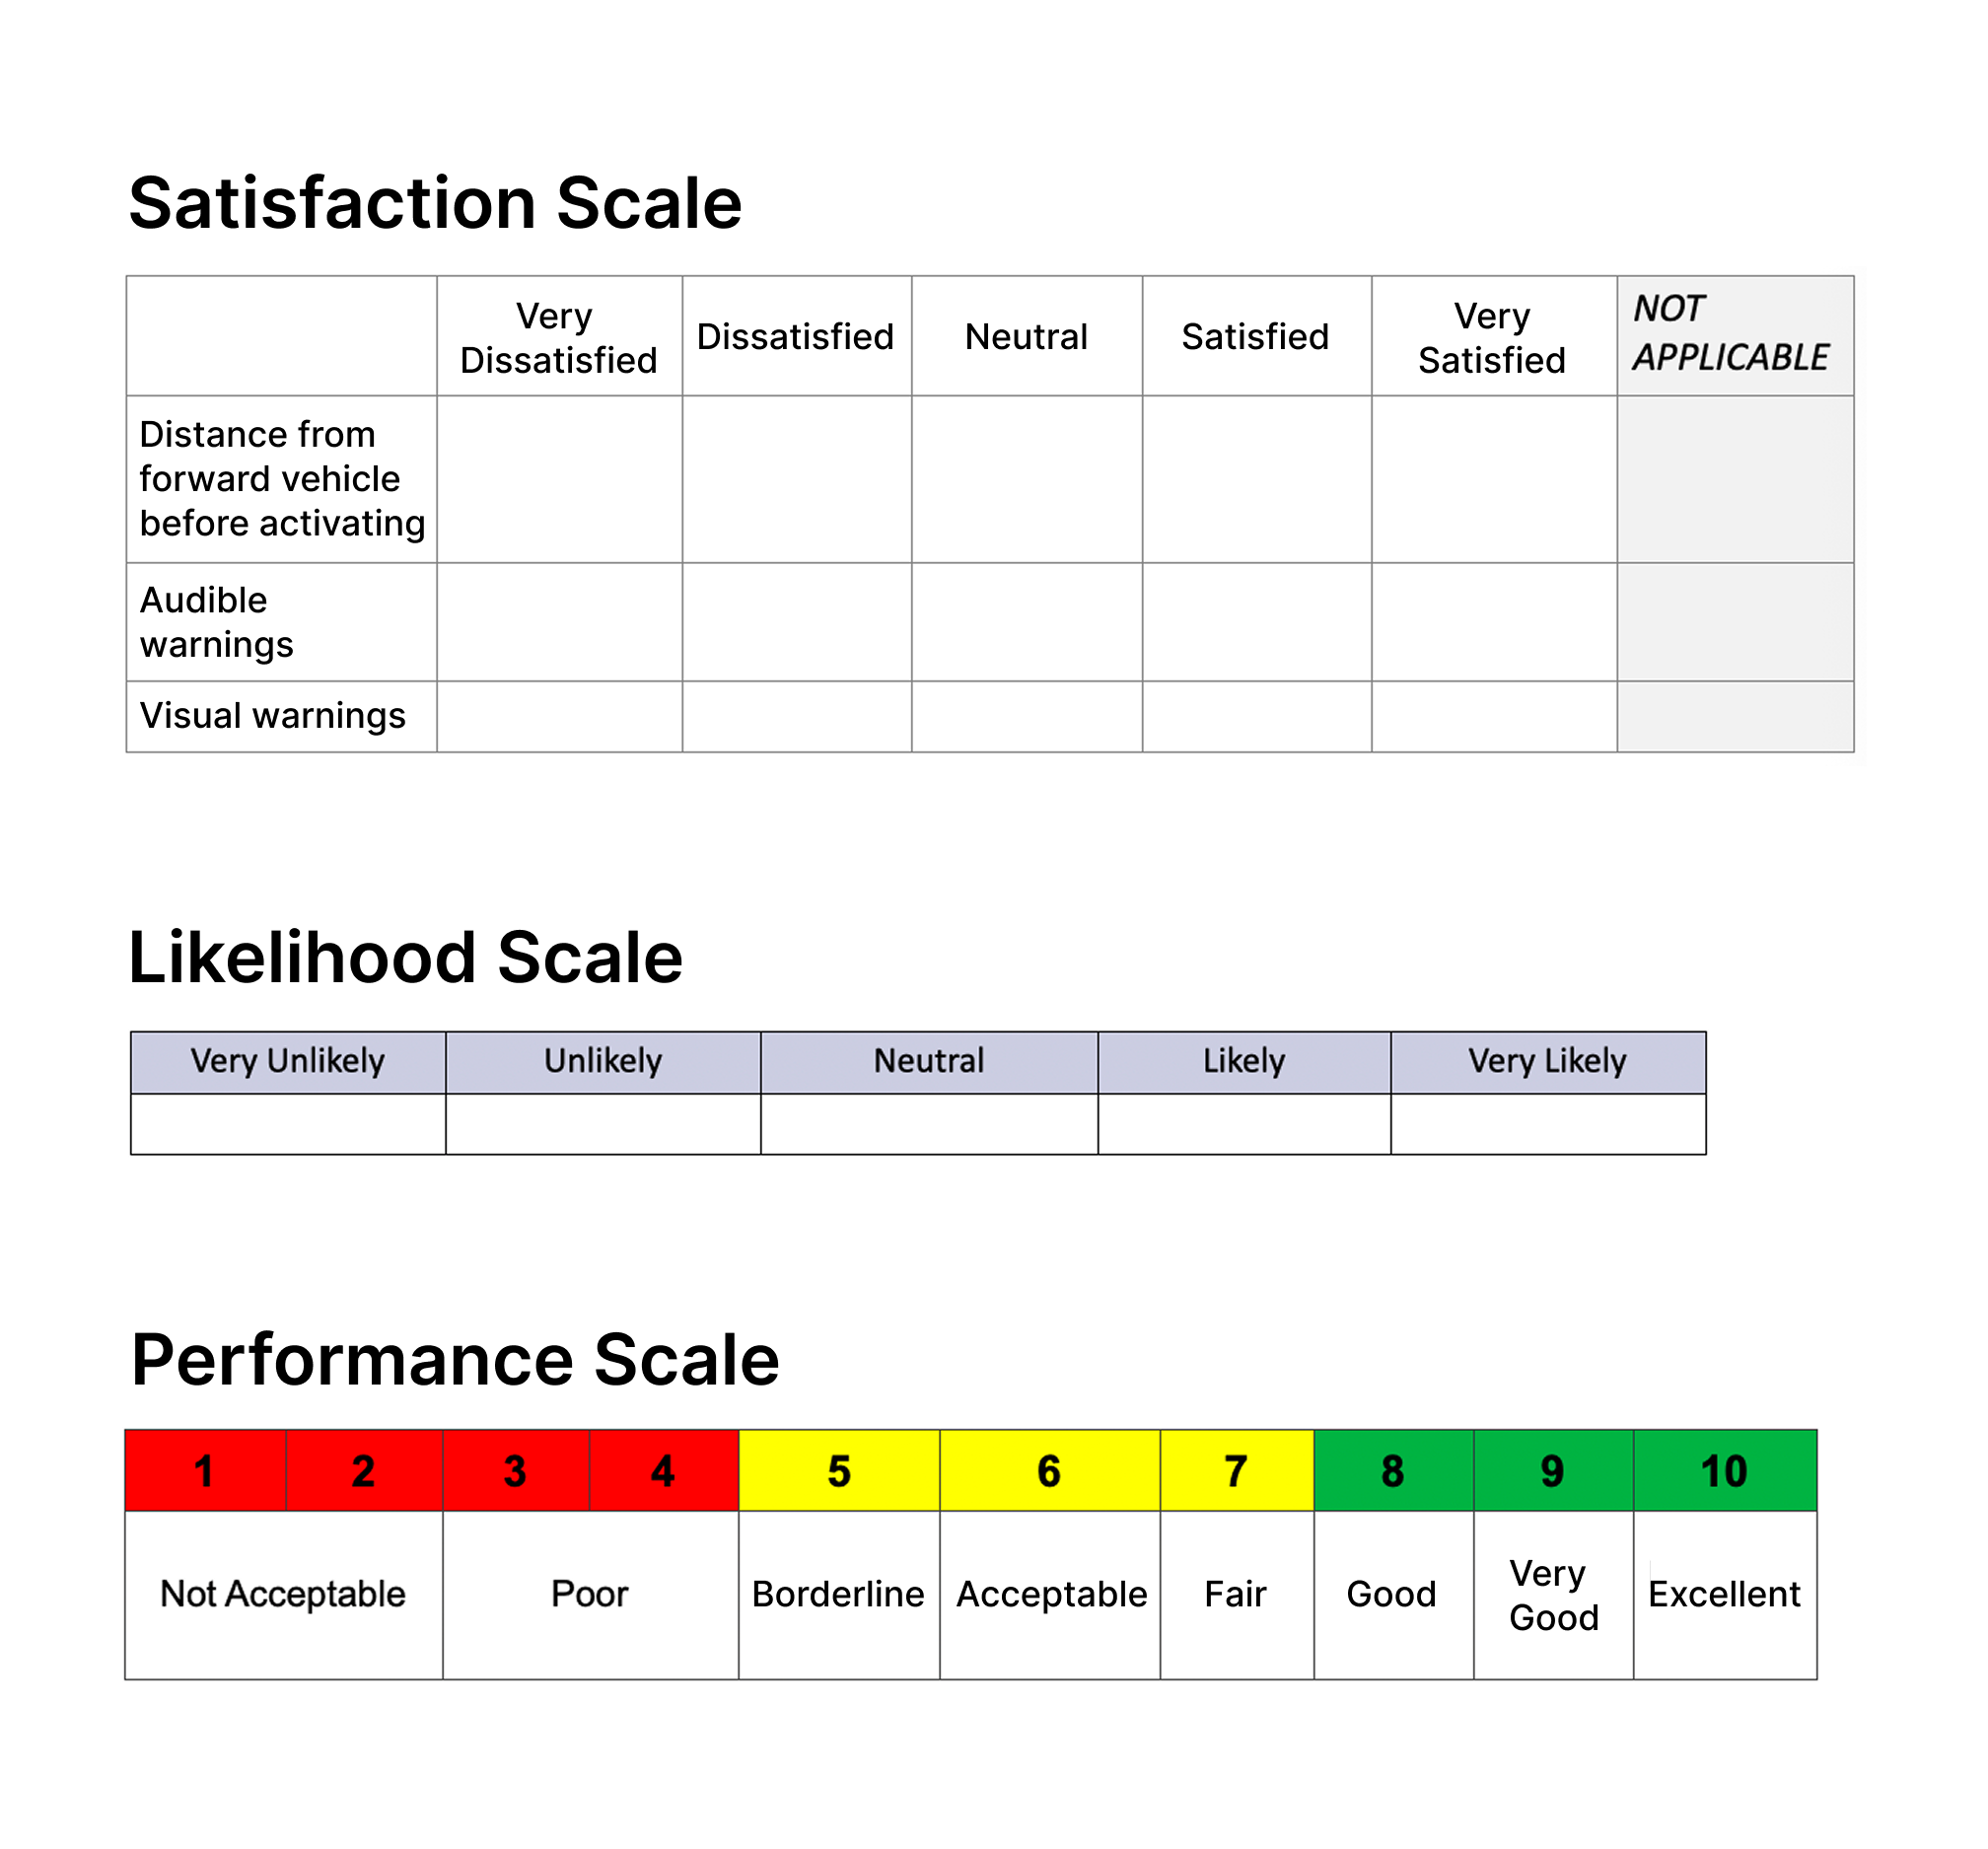
a list of relevant survey scales
Questionnaire Structure
Introduction —> explaining study objectives, capturing consent
Demographic Questions —> capturing participant age, gender, years of heavy-duty trucking experience
Warm-Up Questions —> questions about a typical day during a test drive, their familiarity with PACCAR’s safety system
Core Questions —> a mixture of open-ended questions and rating prompts*
Assessment of Individual Features:
scale: satisfaction with different aspects of the feature
open-ended questions about experience with the feature
scale: likelihood of wanting the feature installed on their vehicle
scale: performance rating of the feature
Assessment of Overall System:
open-ended questions about what works and what doesn’t
scale: performance rating of the overall system
Closing —> an opportunity for the participant to add anything that wasn’t explicitly asked about during the session
*A 5-point likert scale was used to capture satisfaction and likelihood ratings. “Not applicable” was also an option if the participants didn’t experience something during their drive. For the performance ratings, a 1-10 satisfaction rating scale was used.
analysis
Qualitative Analysis
I recorded all sessions and transcribed them. Then I conducted several rounds of affinity mapping sessions before arriving at the final iteration